A Timeless Solution
Strategic Asset Allocation
In this edition...
- Strategic Asset Allocation: A timeless solution Vanguard,
- The second great age of replacement business Eric Armstrong, Client Director - Synaptic
- The fragmented world of adviser tech and provider processes Natalie Holt, Content Editor - the lang cat
- Will the Consumer Duty make your CIP obsolete Antony Champion, Head of Intermediaries - Brewin Dolphin
- Einstein, Benjamin Graham and Napoleon David Macfarlane, Team Head, Discretionary Wealth Management - HSBC Asset Management
- How IFAs can unlock a smooth ride Marc O’Sullivan, Head of Investments - Wesleyan
- Reliance on others Tim Cooper, Freelance Journalist on behalf of EBI
- Boom-bust economics is back! Be warned… John Pattullo, Co-Head of Strategic Fixed Income - Janus Henderson Investors
- Through a glass, darkly Guy Monson, Senior Partner and Chief Market Strategist - Sarasin & Partners
- Diversified income fund and impact Close Brothers , Asset Management
- Sustainable futures Mike Fox, Head of Sustainable Investments - Royal London Asset Management
- Morningstar Wealth Platform: now the real work gets underway Mark Sanderson, Director - Morningstar Wealth Platform
- A new capitalism Seeking value in Japanese equities M&G Investments,
- Is it the end of an era for the UK property market Andrew Robinson, Senior Investment Analyst - RSMR
- Buy, hold or sell? Either way, you need research to evidence your decision John Warby, Business Development Manager - Synaptic

Given the turbulence in recent months across asset classes, the idea of the traditional balanced portfolio, or one based on ‘strategic asset allocation’, i.e., a target allocation for equities and bonds, may seem antiquated. It’s tempting to turn to ‘tactical asset allocation’, striving to take advantage of market trends or economic conditions by actively shifting a portfolio’s allocations. But, if history bears out, investors may be making things worse for themselves by doing so.
You can’t be right just once with tactical asset allocation
There’s a reason why market-timing is difficult. For each tactical move to succeed, investors can’t be right just once. They must be right at least five times:
- Identify a reliable indicator of short-term future market
- Time the exit from an asset class or the market, down to the precise
- Time re-entry to an asset class or the market, down to the precise
- Decide on the size of the allocation and how to fund the
- Execute the trade at a cost (reflecting transaction costs, spreads and taxes) less than the expected benefit.
Even if you’re right most of the time, the gain will likely be marginal
Not only would investors have to be right on all five points above, they would have to repeat this success for most of their trades to make an impact. And the impact would likely be marginal.
The chart below shows that if investors successfully anticipated economic surprises 100% of the time, their annualised return over more than 25 years would only be 0.2 percentage point higher than a traditional balanced portfolio of 60% US stocks and 40% US bonds. We have used historic market performance data for a US portfolio, but we believe the findings are pertinent for UK-based investors too.
An investor who was correct half the time - the equivalent of a coin toss or random chance - would have underperformed the base portfolio. An investor who was correct 75% of the time would have a final balance only $252 greater than the base portfolio.
Growth of $1,000 based on how successful investors were in anticipating economic surprises
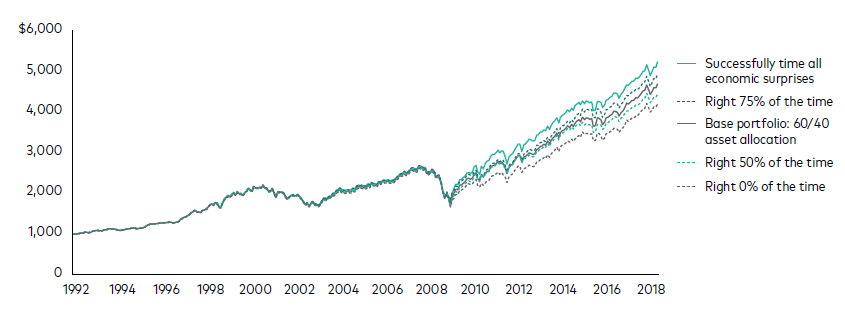
Source: Vanguard paper Here Today, Gone Tomorrow: The Impact of Economic Surprises on Asset Returns, November 2018. Vanguard calculations using data from the U.S. Bureau of Economic Analysis, the U.S. Bureau of Labor Statistics, Bloomberg, and Refinitiv. Notes: The MSCI USA Index and the Bloomberg U.S. Aggregate Bond Index were used as proxies for US stocks and US bonds. The chart represents the growth of hypothetical portfolios with initial balances of $1,000 as at 1 January 1992, growing until 31 August 2018. Significant changes in nonfarm payrolls were used as economic surprises. The hypothetical investors would change the asset allocation to either 80% stocks and 20% bonds in anticipation of a positive economic surprise, or to 40% stocks and 60% bonds in anticipation of a negative surprise. Trading costs were not factored into the scenarios; if they had been, the returns of the tactical portfolios would have been lower. Returns calculated in USD with income reinvested.
Past performance is no guarantee of future returns. The performance of an index is not an exact representation of any particular investment, as you cannot invest directly in an index.
But a few days out of the market can be costly
From 1928 to 2021, there were more than 23,300 trading days in the US stock market. Out of those, the 30 best trading days accounted for almost half of the market’s return. Being out of the market at the wrong time is costly. And many of those best trading days were clustered closely with the worst days in the market, making precise timing nearly impossible.
Annualised returns of US stock market from 1928 until 2021-end
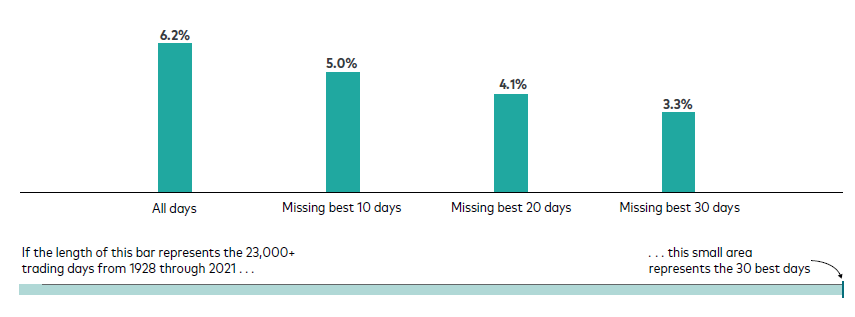
Sources: Vanguard calculations, using data from Macrobond, Inc, as at 31 December 2021. Notes: Returns are based on the daily price return of the S&P 90 Index from 1 January 1928 until the 31 March 1957 and the S&P 500 Index thereafter until 2021-end as a proxy for the US stock market. Returns calculated in USD. The returns do not include reinvested dividends, which would make the figures higher for all bars.
Past performance is no guarantee of future returns. The performance of an index is not an exact representation of any particular investment, as you cannot invest directly in an index.
Even professional asset managers have challenges timing the market
Need further proof on how difficult tactical asset allocation is? The chart below shows the distribution of returns over various periods for tactical asset allocation funds versus strategic asset allocation funds (those in the Morningstar categories of US Flexible Allocation Funds and Target Risk Funds, respectively).
Distribution of annualised returns
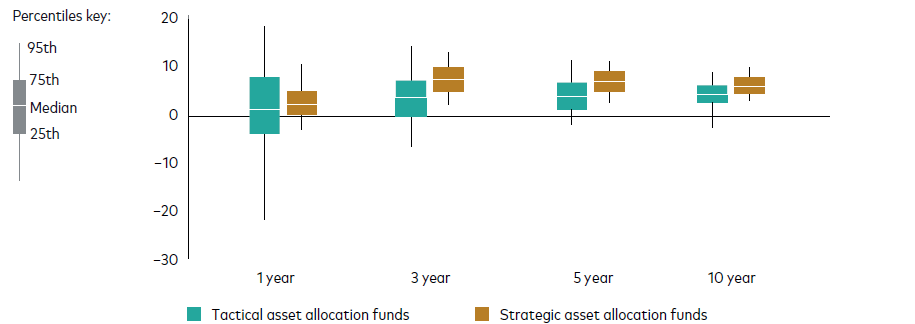
Sources: Vanguard calculations using data from Morningstar, Inc. Data between 3 January 2011 to 31 December 2021.
Notes: Performance calculated on a NAV-to-NAV basis. Returns calculated in USD with income reinvested and net of fees.
Past performance is no guarantee of future returns.
Despite all the advantages of their professional asset managers—armies of analysts, sophisticated computer models and other resources beyond those of the average investor—tactical allocation funds had a lower median return and a greater distribution of outcomes (in essence, more risk) than their counterparts with strategic allocations.
The positive in a market downturn: Higher expected future returns
While the downturn in both stocks and bonds this year has been painful for investors, there is an upside. Lower market valuations mean that future expected returns are higher. For those who are still in the accumulation phase of their investing life, this is a bonus, as they are buying securities at a lower price.
See below our 30-year annualised return expectations for various stock/bond portfolio mixes with a modest tilt to UK markets, in-line with our LifeStrategy fund and LifeStrategy MPS Classic ranges.
Annualised 30-year expected portfolio returns (nominal)
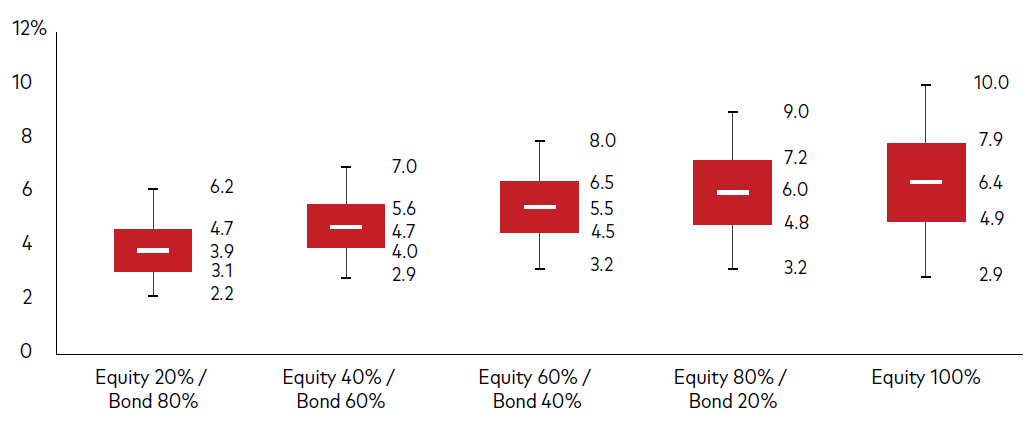
Sources: Vanguard, as at 31 March 2022. Note: Forecast corresponds to distribution of 10,000 VCMM simulations for 30-year annualised nominal total returns in GBP for asset classes highlighted here. Both asset classes had a mix of UK and international securities. The stock allocation was a mix of 25% UK and 75% international; the bond allocation was a mix of 25% UK and 75% currency-hedged international. Benchmarks used within forecasts: UK equity = MSCI UK Index, global ex-UK equity = MSCI AC World ex-UK Index, UK bonds = Bloomberg Sterling Aggregate Bond Index, global ex-UK bonds = Bloomberg Global Aggregate ex-GBP Index.
Any projections should be regarded as hypothetical in nature and do not reflect or guarantee future results.
Strategic asset allocation has endured for a reason
The concept and practice of the balanced portfolio goes back to the 1920s. It’s even older when you read ancient scripts, for example, the Talmudic instruction to divide assets equally into three buckets (land, business, and reserves). Strategic asset allocation, which is used by Vanguard’s LifeStrategy funds and model portfolios, has been bolstered by academic research and has outlasted numerous bear markets. Assuming investors
already have a diversified balanced portfolio appropriate for their goals, time horizon and risk tolerance, the best action may be inaction.
Get in touch
The projections or other information generated by the Vanguard Capital Markets Model regarding the likelihood of various investment outcomes are hypothetical in nature, do not reflect actual investment results, and are not guarantees of future results. Distribution of return outcomes from the VCMM are derived from 10,000 simulations for each modeled asset class. Simulations are as of 31 March, 2022. Results from the model may vary with each use and over time.
The VCMM projections are based on a statistical analysis of historical data. Future returns may behave differently from the historical patterns captured in the VCMM. More important, the VCMM may be underestimating extreme negative scenarios unobserved in the historical period on which the model estimation is based.
The Vanguard Capital Markets Model® is a proprietary financial simulation tool developed and maintained by Vanguard’s primary investment research and advice teams. The model forecasts distributions of future returns for a wide array of broad asset classes. Those asset classes include US and international equity markets, several maturities of the US Treasury and corporate fixed income markets, international fixed income markets, US money markets, commodities, and certain alternative investment strategies. The theoretical and empirical foundation for the Vanguard Capital Markets Model is that the returns of various asset classes reflect the compensation investors require for bearing different types of systematic risk (beta). At the core of the model are estimates of the dynamic statistical relationship between risk factors and asset returns, obtained from statistical analysis based on available monthly financial and economic data from as early as 1960.
Using a system of estimated equations, the model then applies a Monte Carlo simulation method to project the estimated interrelationships among risk factors and asset classes as well as uncertainty and randomness over time. The model generates a large set of simulated outcomes for each asset class over several time horizons. Forecasts are obtained by computing measures of central tendency in these simulations. Results produced by the tool will vary with each use and over time.
Investment risk information:
The value of investments, and the income from them, may fall or rise and investors may get back less than they invested.
Important information:
This document is directed at professional investors and should not be distributed to, or relied upon by retail investors. This document is designed for use by, and is directed only at persons resident in the UK.
For further information on the fund's investment policies and risks, please refer to the prospectus of the UCITS and to the KIID before making any final investment decisions. The KIID for this fund is available in local languages, alongside the prospectus via Vanguard’s website https://global. vanguard.com/.
The information in this article is not a recommendation or solicitation to buy or sell investments nor does it constitute advice.
The Authorised Corporate Director for Vanguard LifeStrategy Funds ICVC is Vanguard Investments UK, Limited. Vanguard Asset Management, Limited is a distributor of Vanguard LifeStrategy Funds ICVC.
Sign up for updates
Keep up to speed with everything you need to know each quarter, by email or post.