
Reviews: the impending regulatory crunch
Connection Magazine Q1 2024
In this edition...
- Synaptic and how to deal with the impending regulatory crunch around reviews Eric Armstrong, Client Director - Synaptic
- Combining code and steel: the new wave of physical-digital firms Kirsty Gibson, Investment Manager - Baillie Gifford & Co
- Automate to Innovate: the start of the Digital Investment Transition Nick Skelhorn, Founder Corrival - Capital Management
- Getting to grips with the gender gap Laura Barnes , Director of Business Development - Nucleus Financial Platforms
- Hunt’s budget pleases hardly anyone Jupiter Asset Management,
- The case for multi-asset portfolios is even stronger Lukas Brandl-Cheng, Investment Strategy Analyst - Vanguard Europe
- Investment Perspectives from RSMR: Are you big in Japan? Stewart Smith, Head of Managed Portfolio Services - RSMR
- The case for sustainable investing Maria Municchi, Sustainable Multi Asset Fund Manager - M&G investments
- Synaptic risk ratings: methodology and approach. Risk profiling and asset allocation Eric Armstrong, Client Director - Synaptic
- Hours to minutes Synaptic,
- The first rule of financial planning: insure the breadwinner Synaptic,
- The new Protection for Synaptic Pathways has arrived Synaptic,
The case for multi-asset portfolios is even stronger

Lukas Brandl-Cheng
Investment Strategy Analyst - Vanguard Europe
 An era of positive real interest rates presents a boost to long-term multi-asset return expectations.
The long-term outlook for diversified multi-asset portfolios has improved markedly as the shortterm pain of rate hikes should mean investors are eventually rewarded with higher total returns - primarily through bond market exposures.
Although interest rates in 2024 are likely to recede from their peaks, in the years ahead we expect them to settle at a higher level than we experienced after the 2008 global financial crisis (GFC). In other words, zero interest rates are yesterday’s news.
We think the structural shift towards higher interest rates is the single best economic and financial development in 20 years for long-term investors. That’s because higher starting yields means stronger bond market returns over the next decade and, coupled with falling inflation, a return to an era of ‘sound money’, whereby interest rates are higher than the rate of inflation (positive real interest rates).
The return of positive real interest rates elevates the risk-free rate, which is the theoretical rate of return for an investment that carries zero risk. The risk-free rate impacts the attractiveness of all asset classes relative to their risk premium, i.e., if the risk-free rate rises, some riskier investments may seem less attractive. In addition, through the power of compounding, positive real interest rates mean investors can reinvest at higher rates.
Bond appetite
Global bond prices have fallen (and yields risen) over the last few years because of the transition to a new era of higher rates. Bond prices tend to fall when interest rates rise because existing bonds paying lower interest become less attractive. Now that rates have peaked or are close to peaking across major economies, coupled with the expectation that rates will remain well-above the ultra-low levels seen post the 2008 GFC, multi-asset investors can expect greater returns from their bond exposures.
The chart below illustrates how developed market government bond yields have bucked their secular decline with interest rates rising considerably in the past couple of years. As a result, our median expected return over the next decade for UK aggregate bonds is almost 5%—which is about 4 percentage points higher than our expectation from two years ago, before the rate-hiking cycle began.
Thanks to the significant increases in rates, the income portion of bond returns has grown markedly – which we expect will not only boost total longterm bond returns but also marks a shift in the contribution of bond income to total portfolio returns.
Decline in developed market bond yields has reversed
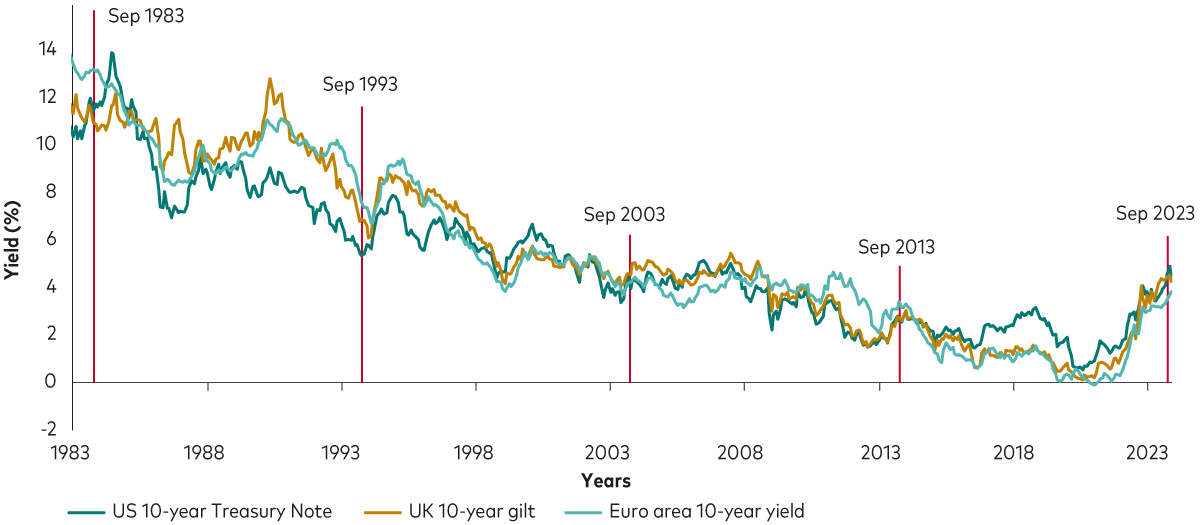
Source: Vanguard, based on data from Refinitiv, as at 24 November 2023. Notes: chart shows yields on 10-year US, UK and euro area government bonds from 31 December 1984 until 23 November 2023 at monthly frequency. UK 10-year gilt refers to the 10-year UK government bond.
Thanks to the significant increases in rates, the income portion of bond returns has grown markedly – which we expect will not only boost total long-term bond returns but also marks a shift in the contribution of bond income to total portfolio returns.
Higher rates leave US equities overvalued
On the equity side of traditional multi-asset portfolios, higher rates are a headwind to stock market valuations, which we think are not yet fully reflected in prices across equity markets. That’s because higher rates depress the range of fair value, owing to higher borrowing costs and more difficult operating conditions for businesses.
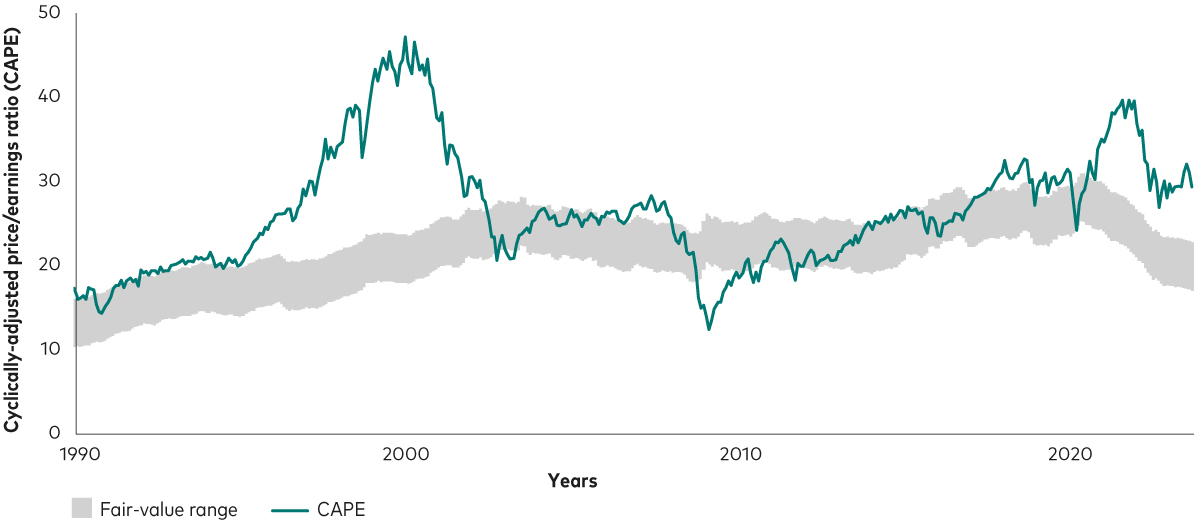
The chart below illustrates this point and shows how US equity valuations, represented by their cyclicallyadjusted price-to-earnings ratio (CAPE) on the green line, are significantly above our estimated fair value range, represented by the grey shaded area. Even though valuations are lower than two years ago, the range of fair value has fallen even further. That means the gap between current valuations and the fair value range has widened, leaving US equity valuations stretched.
Over the long term, our analysis shows that equity prices trade within that fair-value range that depends in part on the macroeconomic environment. With that in mind, we expect valuations to fall closer to the range of fair value over the next decade and drag down total returns for US equities.
US equities are overvalued
Past performance is not a reliable indicator of future results. Any projections should be regarded as hypothetical in nature and do not reflect or guarantee future results.
Source: Vanguard calculations, based on data from Refinitiv and Global Financial Data, as at 30 September 2023.
Notes: The chart on the left shows the cyclically-adjusted price/earnings (CAPE) ratio for US equities, measured by the MSCI USA Broad Market Index. CAPE reflects contemporaneous equity prices and 10-year average historical earnings. The historical fair-value estimate is based on actual levels of inflation and interest rates and reflects underlying data from 31 January 1990.
The picture is a little more nuanced in other regions. The next chart offers some perspective on how US, euro area, UK and emerging market equity valuations have moved since September 2022. As can be seen, euro area equities remain in their fair value range. Emerging market equities moved into undervalued territory, reflecting the region’s weaker market performance compared to some other markets recently.
In the UK, where inflation levels exceeded other regions during most of 2023, the range of fair value was depressed significantly and pushed UK valuations into stretched territory—for now. We expect inflation to continue falling in the UK and interest rates to recede from their peaks, bringing UK equities closer to fair value over time.
How stock market valuations have moved
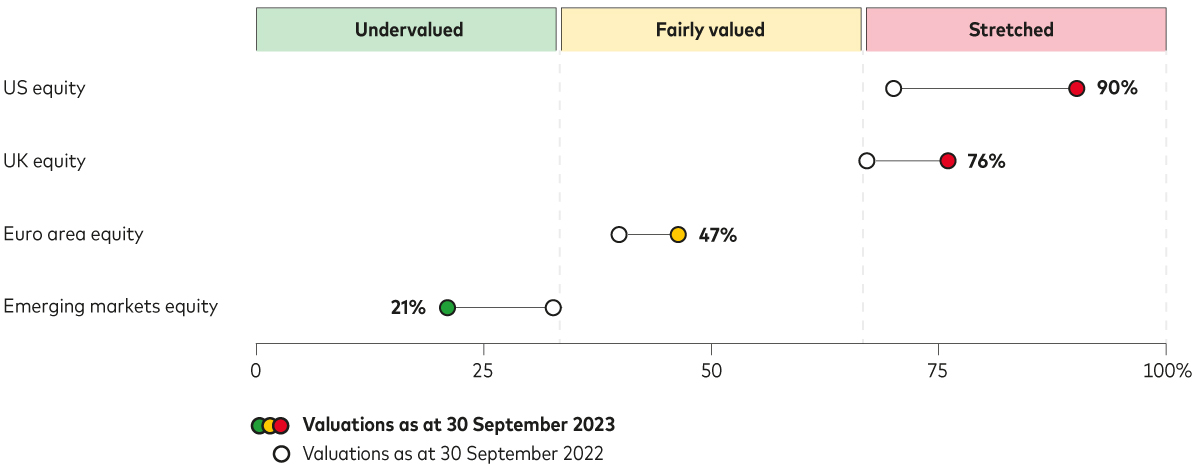
Source: Vanguard calculations, based on data from Refinitiv and Global Financial Data, as at 30 September 2023. The chart shows the valuation percentile relative to fair value for US equities, defined as the MSCI USA Broad Market Index, and for UK, euro area and emerging markets equity, measured by the MSCI UK Index, the MSCI European Economic and Monetary Union (EMU) Index and the MSCI Emerging Markets Index.
Despite the mixed picture for different equity markets, Vanguard believes that a higher interest rate environment will serve long-term investors well, but the transition may be bumpy. For those with an appropriate risk tolerance, a more defensive risk posture may make sense given increased expected fixed income returns and global equity markets that are yet to fully reflect the implications of the return to sound money.
Due to the long-term nature of our valuations and forecasting frameworks, over- or undervaluation should not, in itself, suggest a short-term action on the part of investors. This underscores the challenges facing investors who tilt their portfolios heavily in one direction. We believe that a rigorous investment approach, combined with the principles of broad diversification aligned with the investor’s goals and constraints, offers the best chance of success.
An improved long-term outlook for multi-asset portfolios
Ultimately, the return to sound money and the higher-for-longer interest rate outlook provide the basis for markedly improved multi-asset returns over the next decade.
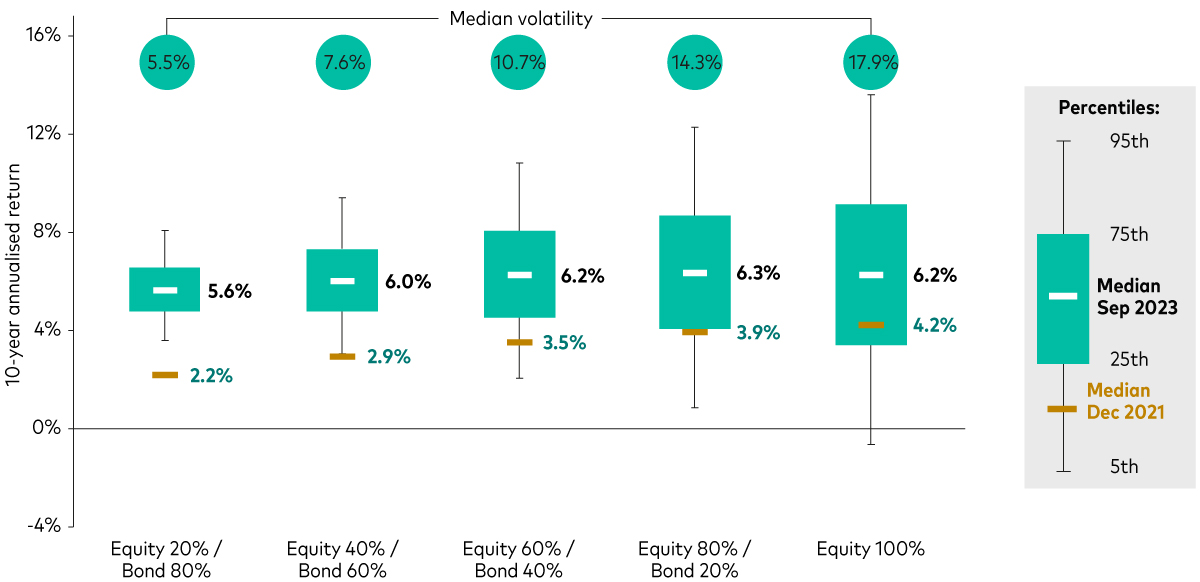
The chart below shows our latest median return expectations over the next decade for various equity/bond mixes relative to our expectations from December 2021. As can be seen, prospective returns are expected to be much higher than before interest rates began to rise across the range of multi-asset portfolios.
Another key point is that there is a smaller difference in expected returns across the risk spectrum, i.e., investors are likely to be rewarded less for taking on equity market risk relative to fixed income risk, and that’s because bond return expectations have improved while particularly the US equity market – representing more than 60% of the global equity market1 – looks overvalued.
10-year multi-asset return forecasts
For well-diversified investors, the permanence of higher real interest rates provides a solid foundation for long-term risk-adjusted returns. However, as the transition to higher rates is not yet complete, near-term financial market volatility is likely to remain elevated. Given the narrowing of expected long-term returns between equity
and bond markets, a more defensive risk posture may make sense for those with an appropriate risk tolerance.
Any projections should be regarded as hypothetical in nature and do not reflect or guarantee future results.
Source: Vanguard calculations in GBP, as at 30 September 2023. Median numbers for the green bars are as at 31 December 2021. Notes: The forecast corresponds to the median of 10,000 VCMM simulations for 10-year annualised nominal returns in GBP for multi-asset portfolios highlighted here. Asset-class returns do not take into account management fees and expenses, nor do they reflect the effect of taxes. Returns do reflect the reinvestment of income and capital gains. Indices are unmanaged; therefore, direct investment is not possible. Equity comprises UK equities and global ex-UK equities. Fixed income comprises UK bonds and global bonds ex-UK (hedged). UK equity home bias: 25%, UK fixed income home bias:
35%. UK equities: MSCI UK Total Return Index, Global ex-UK equities (unhedged): MSCI AC World ex-UK Total Return Index, UK bonds: Bloomberg Sterling Aggregate Bond Index and Global ex-UK bonds (hedged): Bloomberg Global Aggregate ex Sterling Bond Index Sterling Hedged.
IMPORTANT: The projections and other information generated by the VCMM regarding the likelihood of various investment outcomes are
hypothetical in nature, do not reflect actual investment results and are not guarantees of future results. Distribution of return outcomes from VCMMare derived from 10,000 simulations for each modelled asset class. Simulations are as at 31 December 2021 and 30 September 2023. Results from the model may vary with each use and over time.
Investment risk information
The value of investments, and the income from them, may fall or rise and investors may get backless than they invested.
Important information:
This article is directed at professional investors and should not be distributed to or relied upon by retail investors.
This article is designed for use by and is directed only at persons resident in the UK.
The information contained in this article is for educational purposes only and is not a recommendation or solicitation to buy or sell investments.
Issued by Vanguard Asset Management, Limited which is authorised and regulated in the UK by the Financial Conduct Authority.
© 2023 Vanguard Asset Management, Limited. All rights reserved.
Get in touch
www.vanguard.co.uk
enquiries@vanguard.co.uk
Notes:
1. Source: Vanguard calculations based on data from Refinitiv, as at 31 December 2023.
Sign up for updates
Keep up to speed with everything you need to know each quarter, by email or post.