Reviews: the impending regulatory crunch
Connection Magazine Q1 2024
In this edition...
- Synaptic and how to deal with the impending regulatory crunch around reviews Eric Armstrong, Client Director - Synaptic
- Combining code and steel: the new wave of physical-digital firms Kirsty Gibson, Investment Manager - Baillie Gifford & Co
- Automate to Innovate: the start of the Digital Investment Transition Nick Skelhorn, Founder Corrival - Capital Management
- Getting to grips with the gender gap Laura Barnes , Director of Business Development - Nucleus Financial Platforms
- Hunt’s budget pleases hardly anyone Jupiter Asset Management,
- The case for multi-asset portfolios is even stronger Lukas Brandl-Cheng, Investment Strategy Analyst - Vanguard Europe
- Investment Perspectives from RSMR: Are you big in Japan? Stewart Smith, Head of Managed Portfolio Services - RSMR
- The case for sustainable investing Maria Municchi, Sustainable Multi Asset Fund Manager - M&G investments
- Synaptic risk ratings: methodology and approach. Risk profiling and asset allocation Eric Armstrong, Client Director - Synaptic
- Hours to minutes Synaptic,
- The first rule of financial planning: insure the breadwinner Synaptic,
- The new Protection for Synaptic Pathways has arrived Synaptic,
Synaptic risk ratings: methodology and approach. Risk profiling and asset allocation

Eric Armstrong
Client Director - Synaptic
 The regulator puts a lot of emphasis on recommendations being carefully formulated to align: a client’s financial goals; with their attitude to risk and the risk profile of any investments they have.
Without a decent handle on risk, an adviser can’t function. There are risk ratings agencies that have stepped up to ensure risk is managed effectively, but not all risk models are the same. They differ in several important ways, and this article explains the Synaptic system’s approach.
One feature of the Synaptic integration with the Moody’s Analytics stochastic engine is that Synaptic is able to offer firms access to risk analysis that is usually only accessible to institutions. Fundamentally, the Synaptic Risk Rating service allows asset manager’s portfolios and adviser’s investment recommendations to be aligned using an objective measure for risk.
Description
› The Synaptic Risk Rating Service is designed to provide a risk profile for any standard investment, based on Moody’s Analytics stochastic analysis. A standard investment is broadly any retail investment that can be identified by its asset allocation.
› It is a service that is supported by asset managers and fund promoters to facilitate compliance in firms looking to make investment recommendations in line with disclosure and suitability rules around risk.
› It is used by advisers who are looking to make investment recommendations aligned to their client’s:
– Need to take risk;
– Capacity for loss and;
– Risk profile.
› Firms can build an investment approach around the Synaptic asset allocation model, ensuring that their clients’ risk profiles and portfolios are aligned.
Ratings approach
› The Moody’s stochastic engine creates a quarterly update in the form of a mathematical simulation. The model predicts how asset classes across multiple different economies are likely to perform and interact on a probability basis, over the forthcoming years. This enables the asset allocations of clients’ portfolios to be forecast in the same way, creating distribution graphs of results showing the probability of all viable outcomes.
› Moody’s are considered to have the preeminent stochastic model at institutional level, relied on by many asset managers for portfolio optimisation and asset allocation. Historically the model has been very accurate in forecasting returns and profiling risk across investment asset classes.
› Because the Synaptic approach is ‘model driven’, it has advantages over its competitors whose ratings are based on analysts’ assessments. This means that Synaptic is able to provide risk scores ‘on the fly’ as part of the review of a client’s holdings and are not reliant on qualitative views of analysts. This enables Synaptic customers to complete their due diligence at review on an automated basis, saving time and money, ensuring firms are working with accuracy and transparency.
› Asset managers work with Synaptic to ensure that the asset allocations that are attributed to their portfolios are correct, ensuring that the ratings are also therefore reliable. Where you see the risk rating logo, this is the case.
› Synaptic also allows asset managers to publish a rating for both strategic and tactical asset allocations, allowing insight into the strategy as well as supporting informed investment decisions as part of a firm’s financial planning activity.
Ratings explained
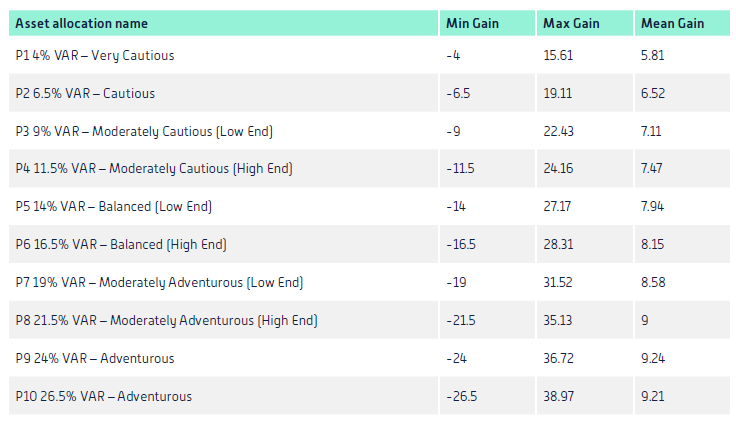
› The complicated bit - a standard Moody’s risk profile is produced for each portfolio consisting of a ‘minimum’, ‘maximum’ and ‘average’ gain. The first two are reading off the stochastic results graph for the various strategic asset allocations at the 95th and 5th percentiles, demonstrating the asymmetry of investment returns. Highlighting 5% of results, the ‘min’ gain is equivalent to the extent and probability of losses ‘in a bad year’, defined as 1 in 20, assuming 20 years. The ‘Average’ gain is the ‘expected return’ and is an arithmetic mean calculated from the overall results of the simulation.
› ‘ Any portfolio’ - using the Moody’s methodology, Synaptic creates a framework against which the risk metrics of any portfolio can be assessed, establishing a ‘risk rating’ as objective measure for risk and loss. The framework is created by analysis of the Moody’s output data to identify an efficient frontier, optimised for risk and return across the range of risk considered appropriate for retail investors. At the time of writing this range is between 0 and -26.5% minimum gain:
› Synaptic offers risk profiling of clients; risk assessment of investments; calculation of capacity for loss; and stochastically calculated growth rates for use in financial planning forecasts.
› Synaptic risk ratings are an integral part of the new Synaptic research and due diligence suite Synaptic Pathways and therefore an integral part of the advice process and compliance for around 450 firms, including networks, large and small IFAs.
Over 1500 advisers have access to the risk ratings through various software packages they subscribe to through Synaptic and there are additional users in the wider adviser community who have access to the Synaptic risk ratings on a free basis. This makes Synaptic one of the most influential and respected risk profiling tools, and the only one that directly accesses the Moody’s stochastic engine.
The system can provide a risk score for any asset allocation presented to the engine. This is of particular use in portfolios which need to be risk assessed in order to align to a client’s risk profile and investment goal.
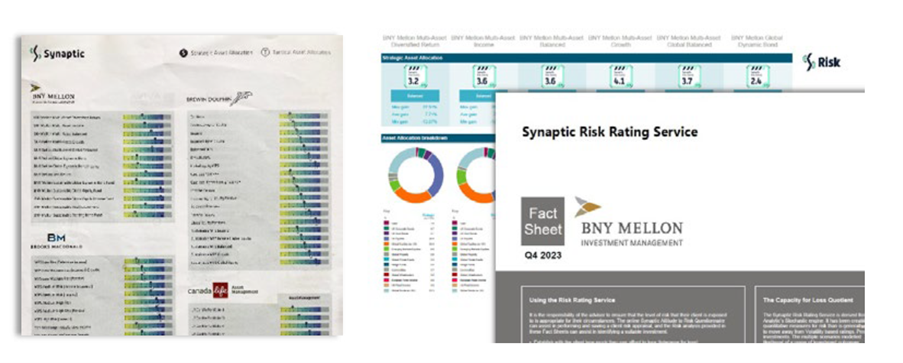
The risk ratings manifest themselves in a range of literature, tables and providers’ fact sheets as well as Synaptic software and online resources. Examples below, including rating in the 1-5 range, which mirror the 1-10 range.
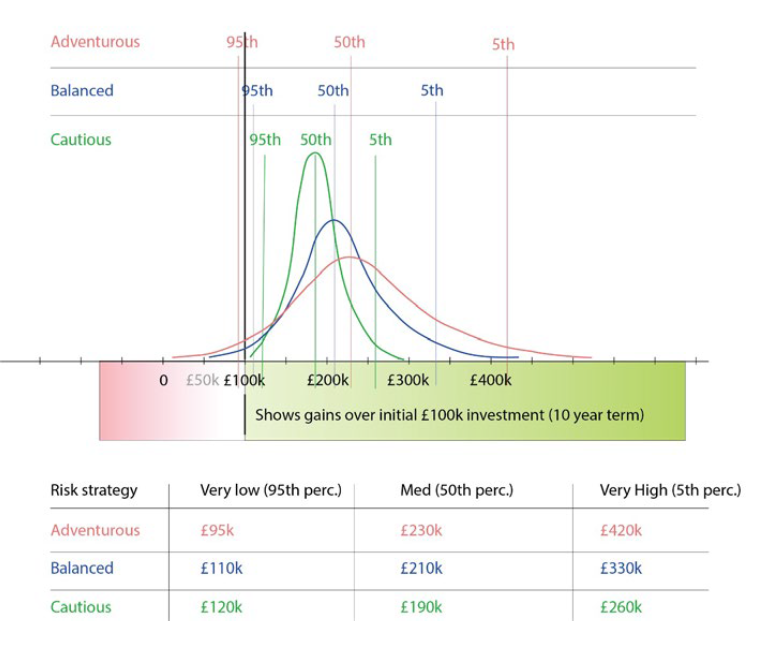
Stochastic results showing probability of returns by percentile (y-axis) against value of returns (x-axis).
For a free trial or
demo call:
0800 783 4477
hello@synaptic.co.uk
For more information,please contact eric.armstrong.synaptic.co.uk
Sign up for updates
Keep up to speed with everything you need to know each quarter, by email or post.